


Use analytics for better decisions
The use of advanced analytics and reporting capabilities is essential to support informed decision-making and improve business performance.
The importance of analytics and reports for business success
Comprehensive data integration
Combine all your data sources on a single platform, eliminate silos, and provide accurate, timely information for informed decisions.
Automated data analysis
Use automated analytics to uncover hidden patterns and insights so you can make fast, accurate decisions based on current and accurate data.
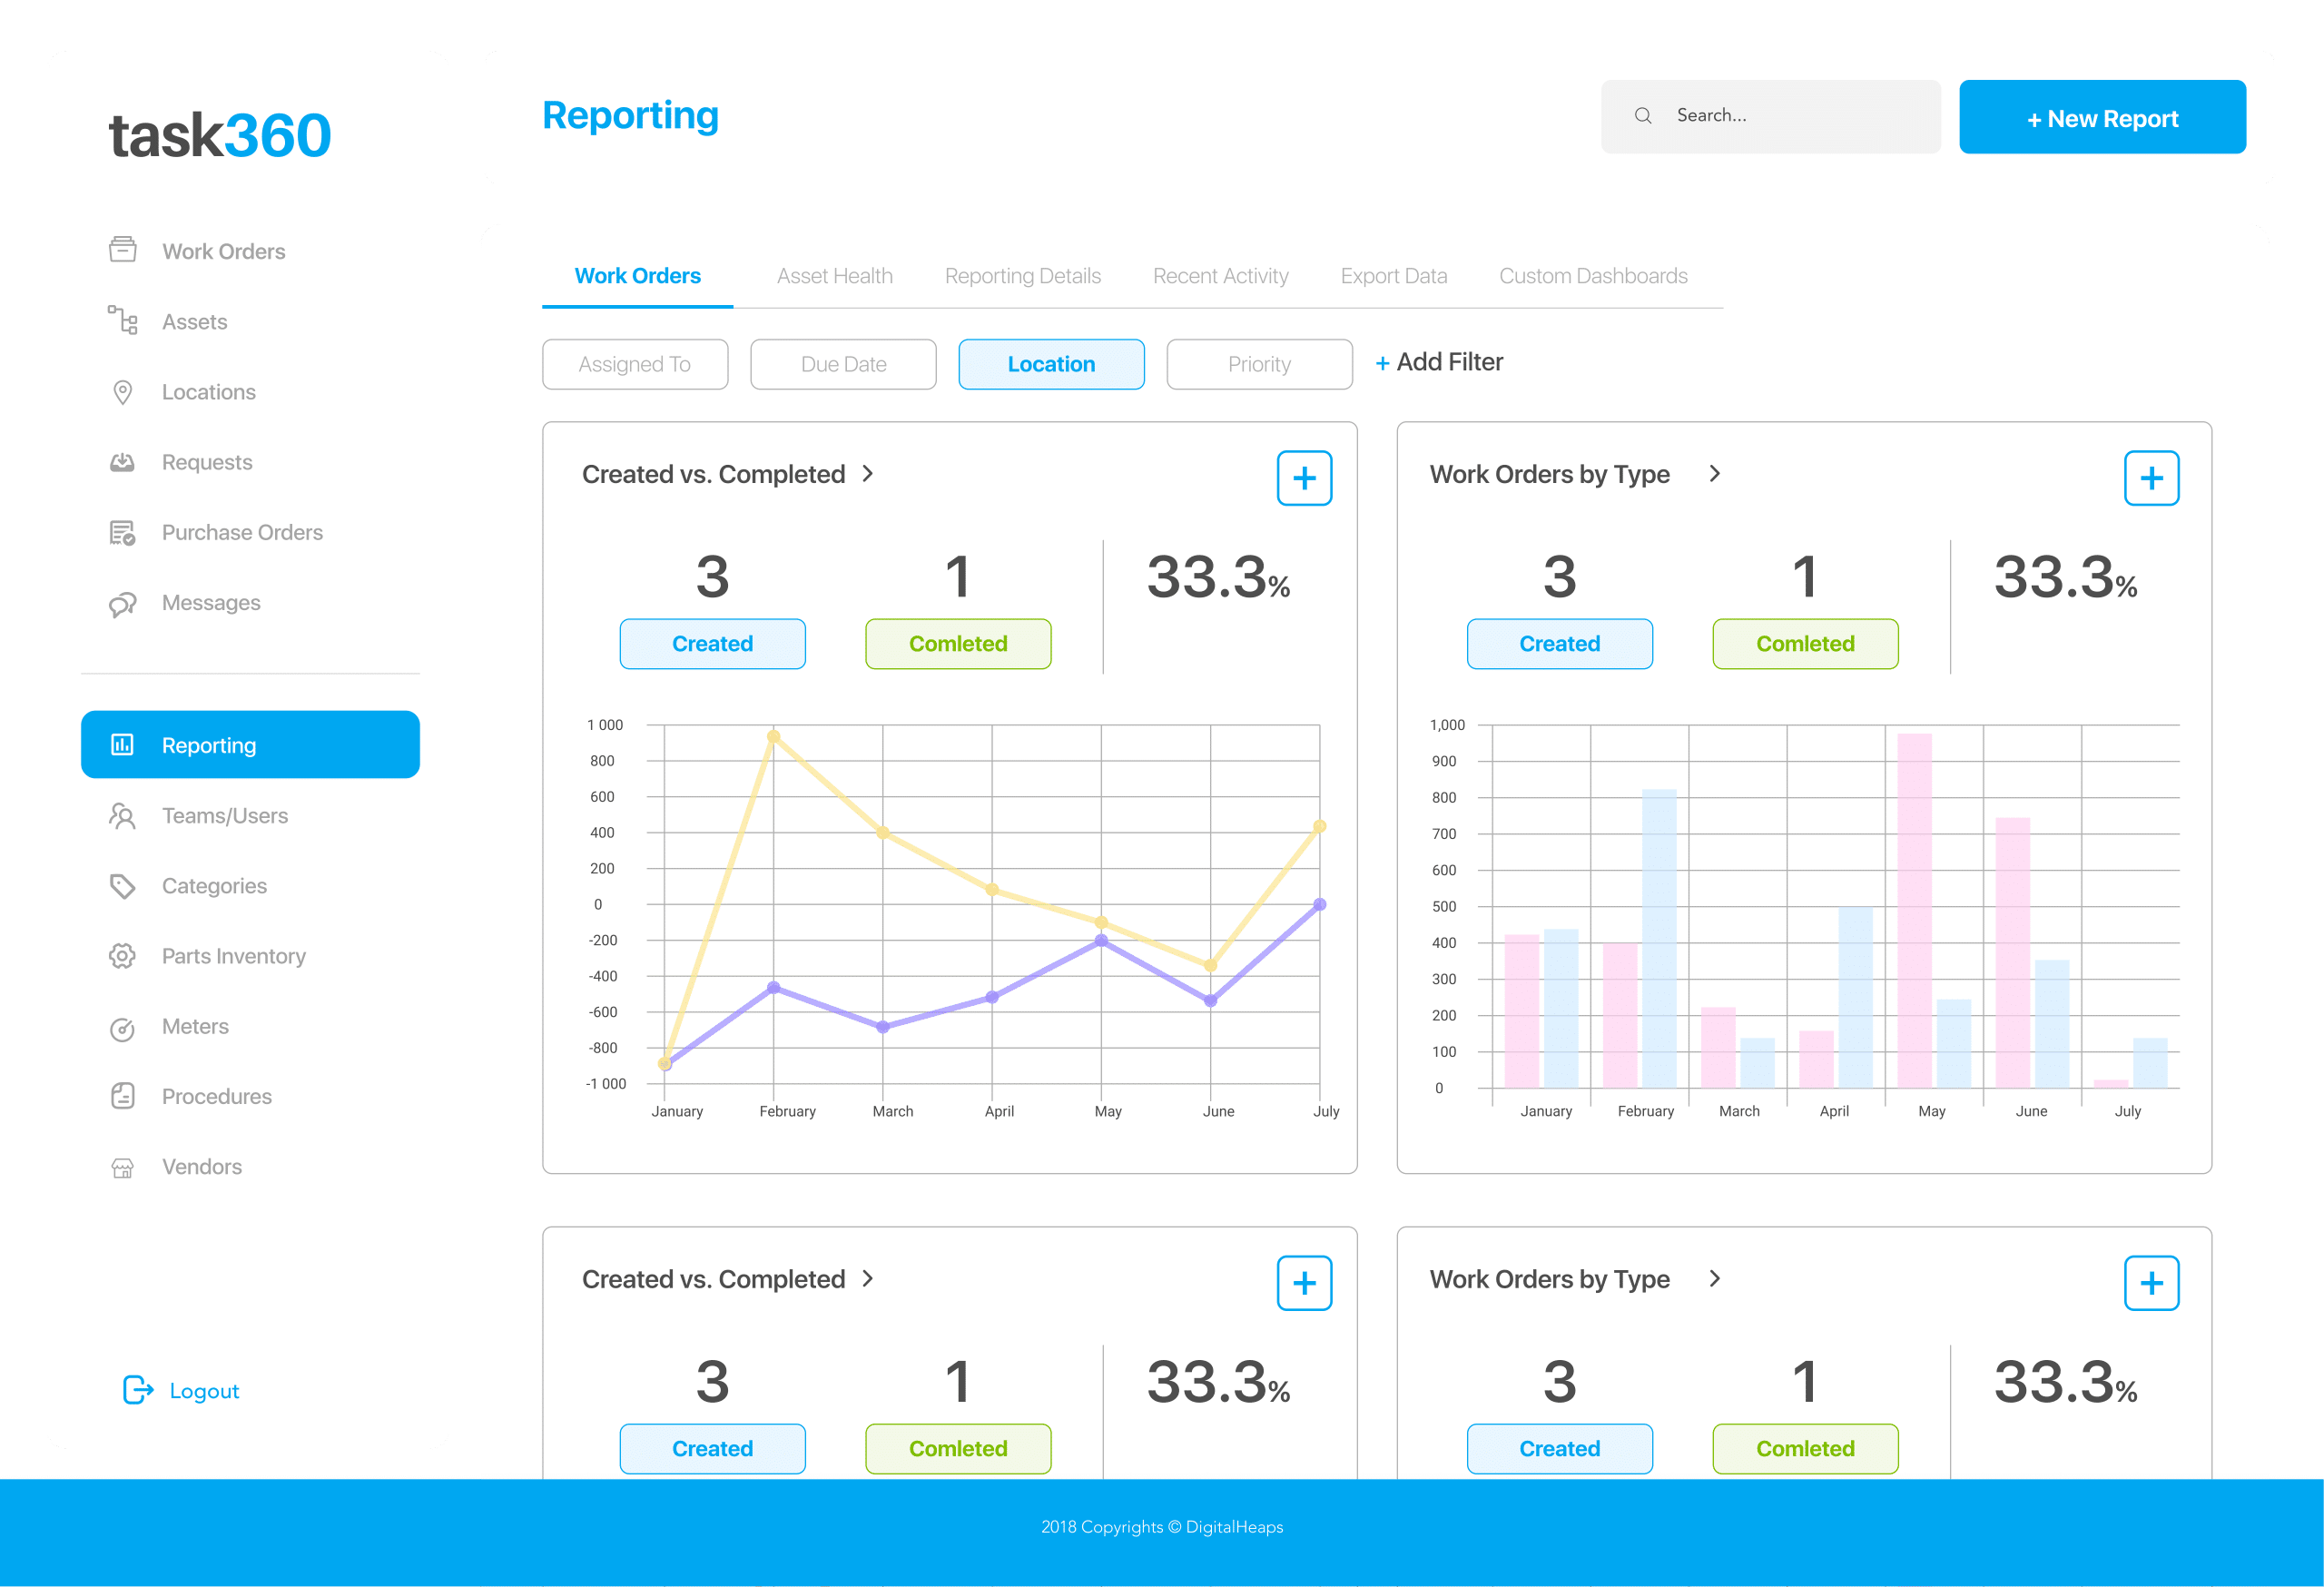
Advanced data visualization
Transform complex data into easy-to-understand visual formats such as charts and dashboards to facilitate the interpretation and effective communication of insights.
Overcome data challenges: Go beyond traditional analytics to gain the right insights.
Relying on traditional methods for data analysis and reporting can lead to inefficiency, inaccurate insights, and missed opportunities. Companies face multiple challenges when leveraging data, including data integration, accuracy, and timely reporting. The increasing volume and complexity of data requires sophisticated approaches to gain meaningful insights and support strategic initiatives.
We are committed to protecting your account with the highest security standards available.
Ready to start your project? Contact us today and get started!
Advanced data visualization
Analytics and reporting tools offer advanced data visualization capabilities by transforming complex data into easy-to-understand visual formats. This improves your ability to effectively communicate insights and make data-driven decisions.
Visuelle Darstellungen wie Tabellen, Diagramme und Dashboards erleichtern die Interpretation großer Datenmengen auf einen Blick, das Erkennen von Mustern und das Verstehen von Trends. Effektive Datenvisualisierung kann die Kluft zwischen Datenwissenschaftlern und Unternehmensführung überbrücken und allen Beteiligten ermöglichen, komplexe Informationen schnell zu erfassen und fundierte Entscheidungen zu treffen. Durch die Umwandlung von Rohdaten in visuelle Erkenntnisse können Unternehmen ihre strategische Planung und betriebliche Effizienz verbessern.
Visuelle Darstellungen wie Tabellen, Diagramme und Dashboards erleichtern die Interpretation großer Datenmengen auf einen Blick, das Erkennen von Mustern und das Verstehen von Trends. Effektive Datenvisualisierung kann die Kluft zwischen Datenwissenschaftlern und Unternehmensführung überbrücken und allen Beteiligten ermöglichen, komplexe Informationen schnell zu erfassen und fundierte Entscheidungen zu treffen. Durch die Umwandlung von Rohdaten in visuelle Erkenntnisse können Unternehmen ihre strategische Planung und betriebliche Effizienz verbessern.


Powerful reporting features
Use analytics and reporting tools to create detailed and customizable reports that you can share with stakeholders. These reports provide valuable insights into business performance and help you streamline your operations and demonstrate accountability. The flexibility of modern reporting tools allows you to tailor reports to the specific needs of different audiences, ensuring the information presented is relevant and actionable.
Detaillierte Berichte unterstützen die Fortschrittsverfolgung, die Identifizierung von Verbesserungspotenzialen und die fundierte Entscheidungsfindung im Einklang mit den strategischen Unternehmenszielen. Regelmäßige und präzise Berichte erhöhen zudem die Transparenz und schaffen Vertrauen bei den Stakeholdern, indem sie die Geschäftsentwicklung und die zukünftige Ausrichtung klar aufzeigen.
Don't let outdated processes and fragmented systems hinder your data analytics efforts.
Leverage modern analytics and reporting tools to empower your team, improve data management, and achieve outstanding business performance. These advanced solutions ensure your organization remains agile, informed, and ready for the challenges of the future.
Frequently Asked Questions (FAQ)
We answer some of the most frequently asked questions about Task360 and its features. Whether you're considering implementing Task360 or already using it, these FAQs provide clear and concise answers to help you understand how Task360 can improve your care processes. If you have any further questions or need further assistance, please feel free to contact our support team!
What is Task360 and how does it improve maintenance management?
Task360 is an advanced maintenance management system for streamlining and optimizing maintenance operations. It extends asset lifespans, reduces downtime, and ensures regulatory compliance through a comprehensive solution. By integrating seamless maintenance workflows, Task360 helps companies manage their resources more effectively, resulting in greater efficiency and lower operating costs.
How can Task360 reduce device downtime?
Task360 reduces plant downtime through real-time monitoring, predictive maintenance, and automated scheduling. The system enables proactive maintenance by identifying potential problems before they lead to failures. Through early problem detection and optimized maintenance tasks, Task360 minimizes unplanned downtime and ensures smooth plant operations.
What ROI can I expect from using Task360?
Companies using Task360 report a significant ROI. On average, users achieve an ROI of up to 652% through improved maintenance processes and reduced operating costs. The system's efficiency in managing maintenance tasks leads to significant savings and improved asset performance, making it a worthwhile investment for any company.