Operational Visibility
Track work orders, maintenance performance, asset status, and team productivity from a single place.
Task360 brings every part of your operation into one platform, from work orders and asset performance to maintenance costs and team productivity. Teams track day-to-day performance in real time, managers spot bottlenecks sooner, and decisions are made on data instead of gut feel.
Maintenance teams generate large volumes of data every day. When that data is not made visible in the right way, opportunities are missed, problems surface too late, and decisions get made without solid backing. Strong analytics show clearly where operations are slipping, which assets consume the most resources, and which processes need improvement.
Track work orders, maintenance performance, asset status, and team productivity from a single place.
See critical metrics in real time, allocate resources more accurately, and set priorities with greater confidence.
Build reports that show how maintenance affects cost, uptime, and overall efficiency in a way leaders can act on.
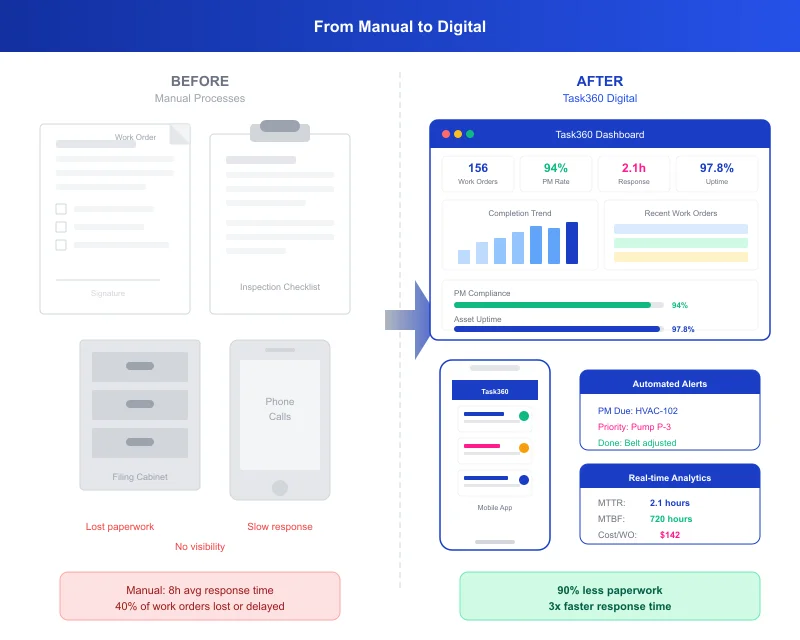
When reporting runs on fragmented tools and manual compilation, data goes stale fast. Teams spend their time pulling data together instead of interpreting it, and managers see the real picture too late. The result is slow decision-making, inconsistent KPI tracking, and low confidence in the numbers.
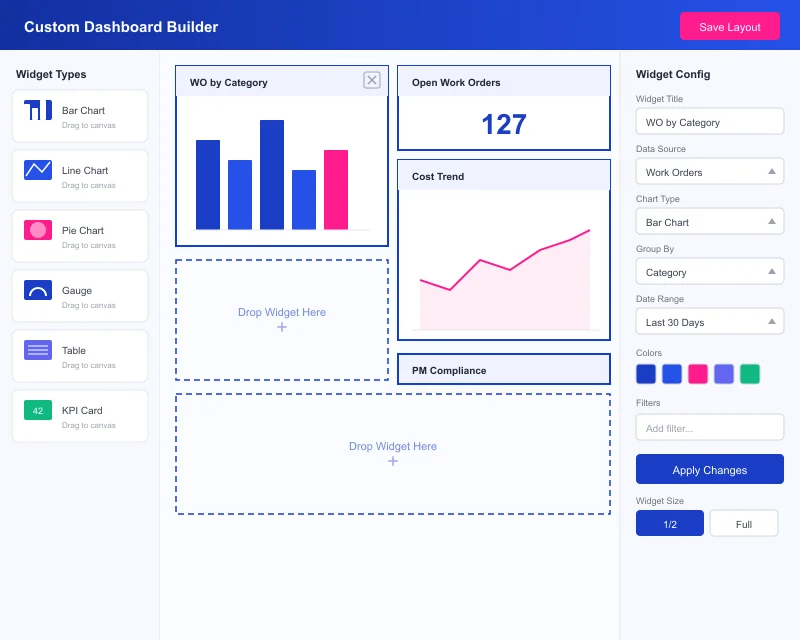
Task360 treats analytics and reporting as a natural part of day-to-day maintenance, not a layer added on top. Build dashboards, follow critical KPIs, slice the data the way you need to, and deliver the right insights to the right people on a regular cadence.
When analytics and reporting are set up the right way, the impact shows up not just in dashboards but in day-to-day operations. Teams know what to focus on, managers spot issues earlier, and the value of maintenance becomes far more visible.
Automated dashboards and a steady flow of regular reports cut down on manual data compilation.
Access to current, meaningful data helps teams set priorities and allocate resources with more confidence.
When work orders, assets, costs, and team performance come together, the whole maintenance operation gets clearer.
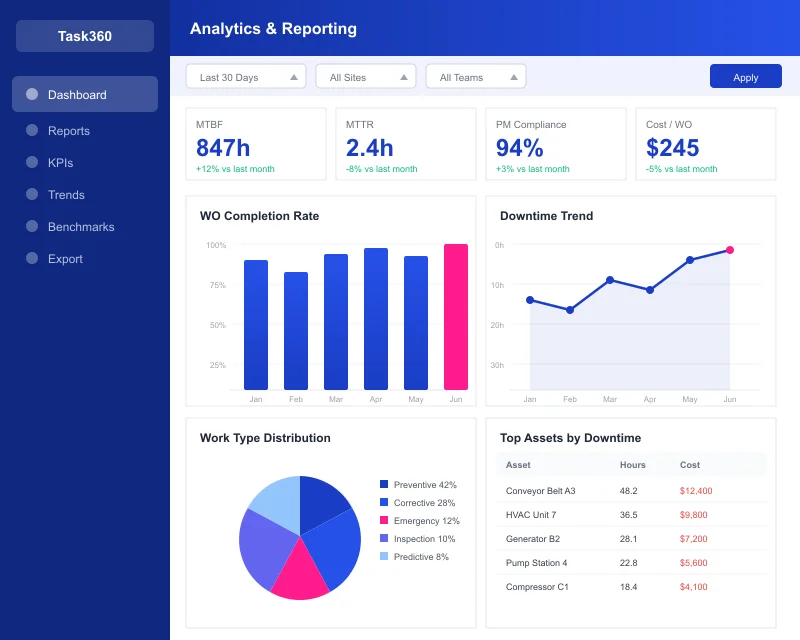
Maintenance reporting software collects data from work orders, asset performance, maintenance costs, and team productivity, and makes it easy to analyze in one place. That gives teams a clearer view of daily maintenance activity and helps them make better decisions.
Maintenance teams can track critical KPIs such as MTTR, MTBF, planned maintenance ratio, maintenance compliance, asset downtime, labor utilization, and maintenance costs. That visibility makes it easier to measure performance and identify areas to improve.
Maintenance reports make recurring failures, delayed jobs, bottlenecks, and high-cost areas easier to see. That helps teams allocate resources more accurately, refine maintenance plans, and reduce unplanned downtime.
Yes. Reports can be filtered by location, team, asset type, date range, and the type of work performed, so each team can quickly reach the insights that match its needs.
Digital reports collect data automatically, keep it centralized, and keep it current. That reduces the risk of errors from manual tracking, cuts the time spent on reporting, and helps teams act on up-to-date insights instead of stale data.
See in a short demo how Task360 dashboards, reports, and operational insights help your team make faster decisions and manage maintenance performance with greater clarity.